
AI analytics dashboards are transforming how businesses analyze data, uncover trends, and make decisions. These tools use machine learning to identify patterns, predict outcomes, and provide actionable insights in real time. Instead of relying on manual reporting or static charts, businesses can now leverage AI to streamline operations, boost productivity, and find opportunities that might otherwise go unnoticed.
Here’s a quick look at 10 AI dashboards making an impact:
| Dashboard | AI Features | Integrations | Starting Price |
|---|---|---|---|
| God of Prompt AI Analytics | Predictive analytics, NLP | Salesforce, QuickBooks | Custom pricing |
| Domo | Automated reporting, ML | Salesforce, HubSpot, Slack | $300/month per user |
| InetSoft | Predictive modeling, real-time | Oracle, SAP, Microsoft Office | $1,500/month |
| Sisense | NLP, automated data prep | Google Analytics, Salesforce | $2,000/month |
| Microsoft Power BI | Natural language Q&A, ML | Microsoft 365, Dynamics 365 | $10/user/month |
| Tableau | Predictive analytics, NLP | Salesforce, Google Cloud | $75/user/month |
| Google Looker | Semantic modeling, ML | Google Workspace, BigQuery | $5,000/month |
| Salesforce Einstein | Predictive insights, discovery | Salesforce, Slack, MuleSoft | $150/user/month |
| Oracle Analytics Cloud | Auto-insights, NLP | Oracle Cloud, Slack | $5/user/month |
| Qlik Sense | Associative analytics, AI prep | Microsoft Azure, Power BI | Custom pricing |
These dashboards excel in different areas, from affordability (Microsoft Power BI) to enterprise-level features (Google Looker). Choosing the right one depends on your business size, tools, and goals.
The God of Prompt AI Analytics Dashboard stands out as a powerful tool, showcasing how AI can transform raw data into meaningful insights. By using advanced AI, it uncovers patterns, detects anomalies, and identifies correlations, giving businesses an edge in today’s fast-paced, data-driven world.
This dashboard goes beyond basic analytics. It uses cutting-edge AI algorithms to monitor data in real time, predict sales trends, and pinpoint inefficiencies, helping businesses make informed, proactive decisions.
What sets it apart is its ability to continuously improve. As fresh data is added, the AI retrains itself to deliver even more accurate predictions. The platform also offers user-friendly features like interactive visuals, plain-language summaries, and color-coded indicators. These tools make complex data easy to understand, even for those without a technical background. Trend lines and drill-down options further guide users toward actionable steps.
Designed with American businesses in mind, the dashboard customizes its format to U.S. standards. Numbers are displayed with commas and periods, dates follow the MM/DD/YYYY format, and financial data is shown in U.S. dollars ($). Temperatures appear in Fahrenheit, and users can choose between imperial or metric measurements. This careful attention to localization ensures that users can focus on insights rather than struggling with data interpretation.
The dashboard seamlessly connects with widely used tools like Salesforce, QuickBooks, Office 365, Google Workspace, Slack, HubSpot, and Mailchimp. It also integrates with both cloud-based and on-premises systems while maintaining high security standards. Data protection is a priority, with compliance to U.S. privacy laws like CCPA, advanced encryption, strict user access controls, and regular security audits. These features make it not only versatile but also secure for practical business use.
The dashboard’s value shines through in real-world scenarios. Take, for example, a U.S. retailer that merged point-of-sale and loyalty program data. By identifying a new customer segment, they increased coupon redemptions by 12%. In logistics, a company used predictive analytics to optimize delivery routes, cutting fuel costs by 8% and improving on-time deliveries. Sales teams have also leveraged the platform to uncover cross-selling opportunities, raising average transaction values by 15%.
Additionally, role-based dashboards cater to specific departments, providing tailored metrics that speed up decision-making processes.
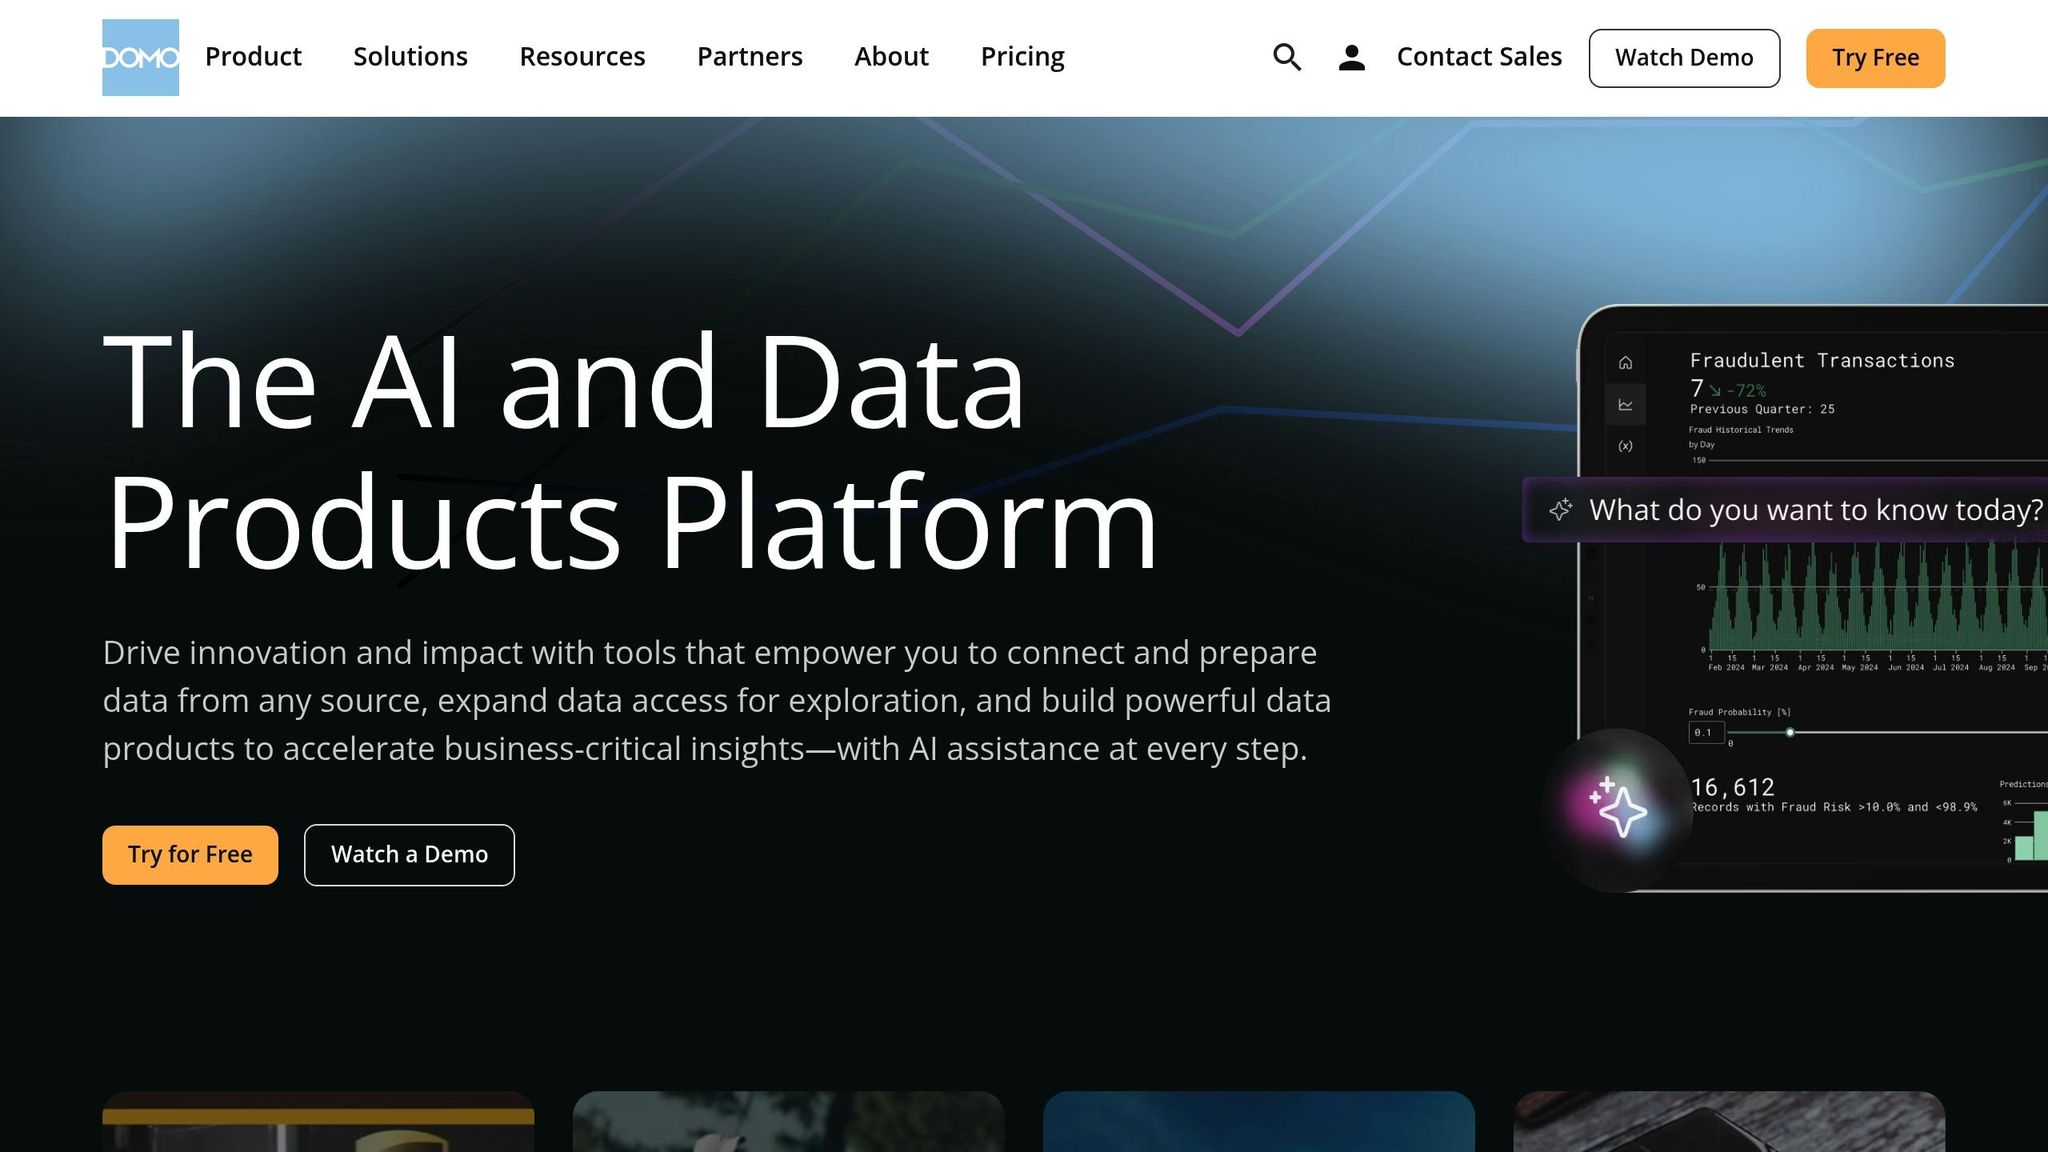
Domo's Business Intelligence Dashboard brings together over 1,000 business tools in a single cloud-based platform. With the help of AI, it transforms scattered data into actionable insights, giving businesses the clarity they need to make informed decisions. This unified system sets the foundation for its advanced AI-driven features.
Domo takes data analysis to the next level by automatically identifying patterns across various sources, forecasting trends, and flagging potential issues before they escalate. With access to over 150 chart types and 7,000 custom maps, businesses can tailor data visualizations to fit their unique needs.
A standout feature is its alert system, widely relied upon by organizations. Linda Fligg, Senior Business Operations Analyst at GE HealthCare, shares:
"Alerts and scheduled reports are probably the features that have the highest usage in all our organization. Alerts tell me whenever a particular value has either increased or decreased by a particular percentage, while scheduled reports literally send me an entire view of what the dashboard looks like on a particular day."
Domo simplifies reporting for U.S. teams by automatically formatting data to align with American standards. Financial data is displayed in dollars ($), dates follow the MM/DD/YYYY format, and numbers use the familiar comma separators. This localization eliminates the need for manual adjustments, making reports instantly understandable for finance teams.
One of Domo's strengths is its ability to integrate with a wide range of business systems. It offers pre-built connectors for platforms like Salesforce, SAP, Excel, Google Sheets, BigQuery, and MySQL. This connectivity breaks down data silos, a common challenge for many organizations.
Bart Butler, Chief Innovation Officer, highlights the platform’s efficiency:
"Domo connected to our legacy data system within four or five minutes. They can really walk the talk."
Thanks to its cloud-based infrastructure, Domo scales effortlessly, supporting unlimited users and data without the need for additional hardware. It connects directly to existing cloud data warehouses, avoiding data duplication and keeping costs under control while maintaining security.
Domo's AI capabilities translate into tangible benefits for businesses across industries:
"Domo ensures every shipment remains compliant. It's the difference between reaction and prevention."
For marketers, Domo offers unparalleled cross-platform visibility. Katie Russell, Digital Marketing Coordinator at Cozy Earth, explains:
"The best thing about Domo is that I can see everything in one place. It saves me so much time because I can see the performance of campaigns across Facebook, Pinterest, Instagram, Snapchat, and Tik Tok all next to each other, and see how each works together."
Domo’s ability to centralize and simplify complex data makes it an invaluable tool for businesses aiming to stay ahead in today’s data-driven world.

The InetSoft Style Intelligence Dashboard is known for its ability to seamlessly combine data from multiple sources and provide real-time analytics. Its user-friendly drag-and-drop interface and customizable visualizations make complex data easy to understand for both technical experts and everyday users. This straightforward design lays the groundwork for the platform's advanced AI-powered analytics.
InetSoft takes its intuitive interface a step further by incorporating AI to generate meaningful insights. The platform's AI engine identifies patterns, detects anomalies, and uncovers correlations, helping businesses forecast trends and predict customer behavior. Features like predictive modeling and automated anomaly detection make it easier to address challenges such as underperforming sales regions or potential customer churn before they escalate.
The dashboard is designed with U.S. users in mind, adhering to local conventions. Financial data is formatted in the U.S. style (e.g., $1,234.56), dates follow the MM/DD/YYYY format, and decimal and thousand separators align with American norms. It also supports both imperial and metric units, catering to a wide range of industries.
InetSoft integrates effortlessly with popular business tools like Salesforce, QuickBooks, Google Analytics, Oracle, and Microsoft SQL Server. This capability allows businesses to consolidate data from various sources into a single, unified dashboard for better decision-making.
The dashboard shines in areas like campaign ROI analysis, customer engagement tracking, and sales forecasting. It also supports real-time inventory management through automated alerts. For instance, one U.S. retailer used InetSoft to identify a connection between regional weather patterns and product demand. This insight helped them adjust inventory distribution, leading to increased revenue and improved customer satisfaction.
With its growing popularity among mid-sized U.S. businesses, particularly in retail, healthcare, and financial services, InetSoft balances advanced analytics with affordability. As the predictive analytics market is expected to grow by 20% by 2025, InetSoft is well-positioned to serve organizations looking for scalable, AI-driven business intelligence solutions.
The Sisense AI Analytics Dashboard simplifies the complexity of data modeling and visualization by incorporating artificial intelligence. Designed to integrate seamlessly into daily business operations, this platform enables organizations to embed actionable insights directly into their workflows, making data-driven decisions more accessible than ever.
With its advanced AI capabilities, Sisense reshapes the way businesses engage with their data. Using natural language processing, the platform allows users to ask straightforward questions in plain English and receive instant, meaningful insights - no technical expertise required. This approach breaks down barriers to data access, empowering teams across the board to identify opportunities that might have otherwise gone unnoticed.
"Sisense delivers an AI-powered analytics platform that streamlines data modeling, visualization, and integration."
Sisense shines in its ability to integrate with tools that are staples in American workplaces, especially Google Workspace. Users can embed analytics directly into Google Sheets and Slides, perform natural language queries, and create visuals that automatically update in real time. These features are distributed via the Google Workspace Directory, ensuring top-tier security and compliance. Beyond Google Workspace, Sisense extends its functionality with Infusion Apps for other widely used platforms like Slack, Microsoft Office 365, and Microsoft Teams. These integrations make accessing and applying data simpler, paving the way for real-time, actionable insights.
Sisense goes a step further by automatically refreshing recurring reports in presentations with the latest data. This capability is especially valuable for executive dashboards, monthly reviews, and client-facing presentations, where precision and up-to-date information are essential.

Microsoft Power BI stands out as a top-tier business intelligence platform in the U.S., trusted by more than 90% of Fortune 500 companies and serving 10 million users every month. Designed with U.S. businesses in mind, Power BI leverages AI to turn raw data into meaningful insights that help drive growth and refine operations.
Power BI offers powerful tools like natural language queries, automated data preparation, and intelligent visualizations. By connecting to various data sources - spreadsheets, databases, and cloud applications - it identifies hidden patterns and trends. These insights have been shown to boost operational productivity by 63% and improve efficiency by as much as 80%.
"We run our business on Power BI reports now. The standard for most meetings or presentations at Avanade is to provide a link to a Power BI report that's connected to official data sources."
- Joseph Paradi, Enterprise Services Executive for Information Technology, Avanade
Power BI automatically formats data to align with U.S. conventions, using dollar signs for currency, dates in the MM/DD/YYYY format, and imperial units for measurements. Its custom format strings feature allows businesses to fine-tune how data is displayed. For example, sales figures can appear as "$1,250.00" for detailed reports or "$1.3K" for quick executive overviews.
The platform’s AI capabilities are enhanced through its smooth integration with widely used U.S. business tools. Power BI works effortlessly with Microsoft 365 and Dynamics 365, helping to eliminate data silos and streamline workflows. For instance, a mid-sized manufacturing company connected Business Central with Microsoft 365 and Power BI. This setup automated invoice approvals and provided real-time financial dashboards, reducing errors and speeding up decision-making.
Power BI's localized and integrated features enable businesses to achieve real results. For example, a retail company used Teams and Azure AI alongside Power BI to deliver personalized customer experiences. Similarly, a logistics company combined Azure IoT with Power BI to optimize its supply chain, cutting costs in the process.
"We're accelerating growth by running a reliable company and using Dynamics 365 Sales and Power BI to make the right decisions to properly manage our business."
- Luis Maurette, CRB Global Head of Sales and Client Management, Willis Towers Watson
With Power BI, businesses can track real-time KPIs for sales, inventory, and financial performance. This real-time visibility empowers companies to act on opportunities and adapt quickly to market shifts.

Tableau stands out as a powerful tool for turning raw data into meaningful insights, especially for U.S. businesses. With its AI-driven capabilities, Tableau makes complex data easier to interpret and act upon, offering tailored solutions that align with U.S. standards and business needs.
Tableau’s localization features are designed with U.S. businesses in mind. Users can configure both Language and Locale settings, ensuring that data is presented in familiar formats. For example:
The platform automatically adapts these settings based on data source inputs, even sorting days of the week according to U.S. conventions, with Sunday as the starting day. For added flexibility, users can adjust these settings at the workbook level. To format numbers as currency, users can select Currency (Standard) or Currency (Custom) from the Numbers drop-down menu under the Workbook Locale setting.
These localization features ensure Tableau integrates seamlessly with U.S. business workflows, offering both precision and adaptability.
Tableau connects effortlessly with widely used U.S. business applications. It includes built-in connectors for Salesforce’s ecosystem, such as Salesforce Data Cloud, Service Cloud, Sales Cloud, and Marketing Cloud Engagement. Additionally, Tableau supports Google Analytics 4, enabling marketing teams to merge web analytics with broader business data for a complete performance overview.
Through Tableau’s Visualization Lightning web component, businesses can embed dashboards directly into Salesforce Lightning pages. This integration streamlines workflows by eliminating the need to toggle between platforms, creating a unified experience.
These integrations deliver measurable benefits. Take RBC Wealth Management – U.S., for example. Previously, financial advisors had to consult up to 26 different systems to prepare for client meetings, a process that consumed 3–4 hours.
"To prepare for client meetings, advisors had to reference up to 26 different systems. It would take 3–4 hours to prepare for the meeting. Now, all the information advisors need is right there at the click of a button." - Greg Beltzer, Head of Technology, RBC Wealth Management - U.S.
With Tableau’s unified dashboard, meeting preparation now takes just minutes. Advisors can spend more time focusing on client relationships and strategic planning instead of sifting through data.
Tableau’s REST API further enhances its functionality, enabling custom integrations and real-time updates. Businesses can automate workflows to keep dashboards current with live data from multiple systems. This is especially useful for sales teams tracking pipelines, marketing teams analyzing campaigns, and operations managers monitoring performance metrics across locations.

Google Looker simplifies complex data, turning it into clear insights that businesses can act on. Built on Google Cloud, Looker provides advanced analytics tools designed to help U.S. companies identify opportunities hidden within their operations.
Looker’s semantic modeling layer makes it easier to understand data relationships, providing a single source of truth. This feature helps businesses quickly spot patterns and anomalies, enabling faster, data-driven decisions. Through its integration with Vertex AI, Looker leverages machine learning to allow even nontechnical users to apply predictive models. These models can forecast trends across key areas like marketing, sales, and operations.
Looker is designed to meet U.S. business needs with flexible formatting options. Users can customize how data - like dimensions, metrics, and calculated fields - appears in visualizations, all without requiring additional SQL queries. For instance, financial reports automatically include dollar signs, dates follow the MM/DD/YYYY format, and numbers use commas for thousand separators.
Looker also supports custom value formatting, similar to Google Sheets. This gives report creators the ability to match their organization’s specific display preferences. For example, to format average order values in U.S. currency, a simple LookML code snippet can be used:
measure: avg_order {
  type: average
  sql: ${sales_price} ;;
  value_format_name: usd
}
This ensures outputs like $1,234.56 align with U.S. financial reporting standards. These localization features enhance Looker’s analytical capabilities while ensuring data is presented in a format familiar to U.S. users.
Looker’s API-first architecture allows it to integrate effortlessly with popular tools used by U.S. businesses, such as BigQuery, Google Marketing Platform, Google Workspace, and Vertex AI. These integrations create a unified system for analyzing data from various sources.
For example, its connection with Google Workspace helps organizations track productivity and collaboration trends across teams. Marketing teams can link Looker to the Google Marketing Platform for in-depth campaign analysis alongside broader business metrics. Additionally, Looker Studio integration offers enhanced visualization options while maintaining consistent data models.
Many U.S. organizations have achieved impressive results using Looker. In March 2023, MLB revamped its business intelligence operations, delivering insights 2–3 times faster and enabling quicker decision-making. Wix utilized embedded analytics powered by Looker to help millions of users grow their businesses. Wayfair consolidated multiple tools into a scalable data platform, improving data access across the company. Likewise, Sky Group cut cloud costs by millions while boosting efficiency through Looker’s dashboards and reports.
These examples highlight Looker’s ability to deliver actionable insights across industries like entertainment, e-commerce, telecommunications, and healthcare, helping businesses make smarter, faster decisions.

CRM Analytics delivers AI-powered insights directly into the daily operations of U.S. businesses. Integrated within the Salesforce ecosystem, it turns raw data into actionable insights, allowing teams to work smarter without hopping between platforms. Building on the advanced AI features of earlier dashboards, CRM Analytics is seamlessly woven into Salesforce workflows.
With CRM Analytics, users can ask questions, predict outcomes, and take action - all without leaving their workflow. The system also identifies anomalies automatically. Its intuitive menu enables users to complete tasks directly within Salesforce. These features have led to tangible benefits: 75% of Salesforce customers report increased productivity, and businesses save an average of 11 hours per month per IT, sales, or operations team member.
Unlike standalone platforms, CRM Analytics is deeply embedded within Salesforce, ensuring smooth integration across key business systems. It syncs effortlessly with Sales Cloud, Service Cloud, Marketing Cloud, and Platform, creating a unified data environment for teams. In addition, it connects Salesforce CRM data with external systems, offering a comprehensive view for decision-making. This holistic approach is especially useful for revenue operations teams. Miriam Lainez, Global Analytics Manager for Revenue Operations at NI, highlights its value:
"For revenue operations, Tableau and CRM Analytics are ideal complements to one another. Tableau provides the deep analysis needed for performance measurement, and CRM Analytics uses that analysis to help people do their jobs even better."
Schneider Electric uses CRM Analytics to gain a consolidated organizational view. Irina Zubova, Vice President of Sales Management and Support at Schneider Electric, shares:
"Leadership needs to have a consolidated view of the organization, down to the entity. This is what we can provide with CRM Analytics dashboards."
Companies adopting data-driven strategies through platforms like CRM Analytics see measurable results, including 5% higher productivity and 6% higher profits compared to competitors.
For pricing, CRM Analytics offers several options: CRM Analytics Growth at $140 per user per month, CRM Analytics Plus at $165 per user per month, and specialized versions at $250 per user per month (all billed annually). This tiered pricing structure makes advanced analytics accessible to businesses of varying sizes and budgets.

Oracle Analytics Cloud offers U.S. businesses a platform where AI is seamlessly integrated into every step of the analytics process. From data ingestion to decision-making, it simplifies complex analytics tasks, making advanced insights accessible to users across all levels.
With Oracle Analytics Cloud, raw data transforms into meaningful insights through its AI-powered tools. The "Auto Insights" feature automatically scans data sets and generates visualizations that highlight patterns and connections you might not notice otherwise. The "Explain" tool digs deeper, uncovering key business drivers, contextual insights, and anomalies - no need to know the exact questions to ask. Plus, the platform includes an AI Assistant that uses generative AI models to provide analytics through a conversational interface. Just ask your questions in plain English, and it delivers sophisticated responses.
Oracle Analytics Cloud is designed with American businesses in mind. It supports U.S. date formats (mm/dd/yy), uses periods for decimal points and commas for thousand separators, and displays currency in standard U.S. dollar formatting (e.g., $1,234.56). This ensures that financial reports and dashboards align with familiar conventions, making the platform easy to adopt.
The platform goes a step further by integrating with tools many U.S. businesses rely on. With over 35 native data connections, it connects effortlessly to major cloud services like Microsoft Azure and Google Cloud. It also works with collaboration platforms like Slack and Microsoft Teams, and business applications such as Salesforce, SAP, Shopify, Snowflake, and Workday, thanks to prebuilt, low-code adapters [62, 63, 64].
Oracle Analytics Cloud delivers results across industries. In healthcare, it supports real-time data analysis for patient triage and early diagnosis, even integrating advanced imaging. Customer service teams benefit from smart call routing and chatbots that speed up decision-making. In finance, it helps detect fraud, manage expenses, and automate billing. For instance, in March 2023, MVH revamped its finance and HR processes across 20 countries using Oracle Analytics Cloud, while a leading bicycle manufacturer streamlined operations by integrating its E-Business Suite with Oracle Cloud Infrastructure. The platform also empowers data scientists with built-in algorithms for predictive modeling, including numeric prediction, classification, and clustering. Tools like OCI Vision and OCI Document Understanding further expand its business applications [57, 58, 59, 63].

Qlik Sense is a powerful analytics platform designed to connect and analyze data from hundreds of sources, creating a unified view that helps uncover untapped business opportunities.
With its AI capabilities, Qlik Sense simplifies data preparation and analysis by offering analytics-ready data through an intuitive self-service catalog.
For businesses in the U.S., Qlik Sense integrates effortlessly with tools like Microsoft Power BI, Azure, Fabric, and OneLake. It supports both no-code and code-based embedding options, making it easy to connect multiple data sources. Open APIs provide the flexibility to customize analytics solutions and embed them into existing applications. Additionally, its application automation features allow businesses to build workflows and trigger actions across various cloud applications. These integrations ensure that insights can be applied directly to day-to-day operations.
Qlik Sense stands out for its ability to deliver actionable insights that guide strategic decision-making. Its strength lies in embedded analytics and advanced AI/ML data management, especially when used alongside other Qlik products. This combination makes it a valuable tool for businesses aiming to turn data into meaningful actions.
This table provides a breakdown of key features across various AI analytics dashboards, helping U.S. businesses identify the best fit for their needs. Whether you're aiming to streamline operations, improve decision-making, or uncover new opportunities, aligning the right tools with your goals is essential. Below, you'll find a comparison of the main features, integrations, and pricing for popular platforms.
| Dashboard | AI Capabilities | U.S. Business Tool Integration | Industry Focus | Customization Level | Starting Price |
|---|---|---|---|---|---|
| God of Prompt AI Analytics | Natural language processing, automated insights, predictive analytics | QuickBooks, Salesforce, Google Workspace, Microsoft 365 | Cross-industry, marketing focus | High – drag-and-drop interface, custom templates | Custom pricing |
| Domo Business Intelligence | Machine learning, anomaly detection, automated reporting | Salesforce, QuickBooks, HubSpot, Slack | Retail, healthcare, manufacturing | Medium – pre-built apps, custom connectors | $300/month per user |
| InetSoft Style Intelligence | Self-service analytics, predictive modeling, real-time processing | Microsoft Office, Oracle, SAP | Financial services, government | High – pixel-perfect reporting, custom dashboards | $1,500/month |
| Sisense AI Analytics | Natural language queries, automated data prep, smart recommendations | Salesforce, Google Analytics, AWS, Azure | E-commerce, healthcare, finance | High – white-label options, API customization | $2,000/month |
| Microsoft Power BI AI | Cognitive services, automated ML, natural language Q&A | Microsoft ecosystem, Dynamics 365, Teams | Enterprise, government, education | Medium – custom visuals, embedded analytics | $10/user/month |
| Tableau AI Insights | Natural language querying, data explanations, predictive analytics | Salesforce ecosystem, Google Cloud, AWS | Healthcare, retail, financial services | High – calculated fields, custom extensions | $75/user/month |
| Google Looker AI | BigQuery ML integration, smart analytics, automated insights | Google Workspace, Cloud Platform, third-party APIs | Technology, media, retail | High – LookML modeling, embedded analytics | $5,000/month |
| Salesforce Einstein Analytics | Predictive analytics, automated discovery, smart data prep | Salesforce, Slack, MuleSoft | Sales, marketing, customer service | Medium – pre-built templates, custom apps | $150/user/month |
| Oracle Analytics Cloud AI | Machine learning, natural language processing, auto-insights | Oracle Cloud applications, on-premise systems | Enterprise, manufacturing, finance | High – pixel-perfect reports, custom calculations | $5/user/month |
| Qlik Sense AI | Associative analytics, cognitive engine, automated insights | Microsoft Azure, Power BI, cloud applications | Manufacturing, healthcare, government | High – no-code embedding, open APIs | Custom pricing |
The table highlights diverse approaches to AI-powered business intelligence. Features like natural language processing are becoming standard, with platforms such as God of Prompt AI Analytics and Sisense offering intuitive query interfaces. This aligns with the fact that 80% of business leaders prioritize data-driven decisions, even as nearly 30% feel overwhelmed by the data volume they manage.
Integration is a major factor when choosing a platform. For example:
Pricing varies significantly based on features and market focus. Enterprise-level solutions like Google Looker AI and InetSoft Style Intelligence come with premium pricing, ranging from $1,500 to $5,000 monthly. On the other hand, platforms like Microsoft Power BI, starting at $10 per user per month, make AI analytics more accessible for smaller businesses.
Customization is another critical factor. High-customization platforms like Tableau and Qlik Sense allow businesses to tailor their dashboards to specific needs. According to McKinsey's 2023 Global Survey, companies that integrate AI into decision-making see a 5–6% productivity boost.
Industry-specific tools also play a role. Many platforms cater to sectors like healthcare, retail, and financial services. For example, AI-driven demand forecasting in retail can reduce forecast errors by up to 75%, showcasing the importance of tailored solutions.
Ultimately, no single platform is a one-size-fits-all solution. Success depends on matching the platform's strengths with your business requirements, integration preferences, and budget. With Gartner predicting that 90% of leaders will rely on AI-generated insights by 2025, choosing the right dashboard is a strategic move for staying competitive.
Business intelligence has evolved dramatically, and AI-powered analytics dashboards have become a must-have for staying ahead in today’s competitive landscape. According to Gartner, 90% of business leaders will depend on AI-generated insights by 2025. This trend underscores the growing edge that AI-driven decision-making has over traditional methods.
The dashboards we've examined highlight how AI can turn raw data into actionable insights - often uncovering opportunities that conventional analysis might overlook. These tools are not just about crunching numbers; they’re about reshaping business strategies and driving meaningful results.
For U.S. businesses, aligning analytics tools with local systems is a game-changer. Dashboards that seamlessly integrate with widely used platforms like QuickBooks, Salesforce, and Microsoft 365 make implementation smoother and insights more accessible. As we've seen, the success of these tools often hinges on how well they fit into existing workflows rather than just their technical specs. This practical integration ensures that businesses can maximize the advanced AI capabilities discussed earlier.
The benefits are clear and measurable. McKinsey’s 2023 report reveals that organizations using AI in decision-making see a 5–6% boost in productivity. Similarly, Deloitte found that 87% of companies with structured AI adoption frameworks outperform their competitors in leveraging data. These figures emphasize the competitive edge AI tools bring to the table.
What truly sets these dashboards apart is their ability to shift businesses from being reactive to proactive. They don’t just analyze what has already happened; they predict future trends and optimize operations in real time. Whether it’s improving inventory management or enhancing customer retention, these tools empower companies to seize opportunities before they pass by. The result? A smarter, more agile approach to business growth.
AI-powered analytics dashboards are transforming how businesses make decisions by offering real-time insights from complex datasets. These tools analyze and highlight patterns in areas such as customer behavior, marketing effectiveness, and operational efficiency, revealing opportunities that might have gone unnoticed.
With these insights, businesses can make smarter choices, allocate resources more effectively, and discover new ways to generate revenue. This forward-thinking approach helps companies stay agile in a fast-changing market, ensuring they remain competitive while fueling growth and progress.
When choosing an AI analytics dashboard, it's crucial to consider data compatibility. The dashboard should integrate seamlessly with your current systems and effectively manage the specific types of data your business handles. Without this alignment, you might face unnecessary hurdles in your workflow.
Another critical factor is ease of use. A dashboard that's intuitive and user-friendly ensures that your entire team, regardless of technical expertise, can navigate it with confidence. After all, the best tools are the ones your team can actually use effectively.
Look for dashboards that come equipped with AI-powered features like automated insights and predictive analytics. These capabilities can help you identify hidden opportunities and make more informed decisions quickly. Lastly, evaluate whether the dashboard fits your company's goals, team skills, and infrastructure. The right tool will provide actionable insights that genuinely enhance your decision-making process.
AI-powered dashboards transform how businesses operate and make decisions by offering real-time insights and predictive analytics. These tools dig deep into data to highlight inefficiencies, predict trends, and suggest practical solutions. The result? Businesses can allocate resources smarter and fine-tune their processes for better efficiency.
Beyond operations, these dashboards analyze customer behavior, market trends, and internal data to reveal opportunities that might otherwise go unnoticed. By tackling challenges head-on and shaping focused strategies, businesses can react faster and make sharper decisions - ultimately driving better performance and growth.